
Banks create money when they:
Rationale
Banks create money when they make loans.
When banks provide loans to borrowers, they effectively increase the money supply in the economy through the process of fractional reserve banking. By lending out a portion of deposits while keeping a fraction in reserve, banks create new deposits, which constitutes new money.
A) accept deposits Accepting deposits is a fundamental banking activity, but it does not directly create new money. Deposits are simply liabilities for the bank, reflecting the funds that customers have entrusted to them. While deposits enable banks to lend, the act of accepting them alone does not expand the overall money supply.
B) transfer reserves Transferring reserves between banks does not create new money; it merely redistributes existing funds in the banking system. When one bank transfers reserves to another, it adjusts the account balances but does not increase the total amount of money available in the economy.
C) vault cash Vault cash refers to the physical currency that banks hold on-site to meet withdrawal demands. While necessary for daily transactions, vault cash itself does not create money. It is part of the bank's reserves and does not contribute to an increase in the money supply unless it is lent out or deposited into circulation.
D) make loans Making loans is the primary way banks create money. When a bank issues a loan, it credits the borrower's account with a deposit that did not previously exist, effectively expanding the money supply. This process allows banks to support economic growth while maintaining only a fraction of deposits as reserves.
Conclusion Banks play a crucial role in money creation primarily through the act of making loans. This process generates new deposits and increases the money supply, facilitating economic activity. In contrast, accepting deposits, transferring reserves, or vaulting cash do not contribute to money creation but are instead part of the bank's operational framework. Understanding this fundamental mechanism illustrates the critical function banks serve in the economy.
Fed decreases federal funds target: short-run effect:
Rationale
AD shifts right.
When the Federal Reserve decreases the federal funds target, it typically lowers interest rates, which stimulates borrowing and spending in the economy. This increased expenditure shifts the Aggregate Demand (AD) curve to the right, reflecting higher demand for goods and services in the short run.
A) SR Phillips shifts right The Short-Run Phillips Curve illustrates the inverse relationship between inflation and unemployment. A decrease in the federal funds target does not directly cause the SR Phillips Curve to shift; instead, it may influence points along the curve. The shift of the SR Phillips Curve typically occurs due to changes in expectations of inflation rather than changes in interest rates.
B) AD shifts right Lowering the federal funds target reduces interest rates, encouraging increased consumer spending and investment by businesses. This heightened economic activity results in a rightward shift of the Aggregate Demand curve, demonstrating the short-run impact of the Fed's monetary policy decision.
C) nominal rate decreases While a decrease in the federal funds target does lead to a decrease in nominal interest rates, this option does not capture the broader economic consequence of the Fed's action. The nominal rate's decrease is more of a mechanism rather than an immediate short-run effect on the economy's overall demand.
D) dollar appreciates A decrease in the federal funds target typically leads to lower interest rates, which can result in a depreciation of the dollar rather than an appreciation. Lower interest rates can reduce foreign investment appeal, leading to a weaker dollar against other currencies, contrary to what this choice suggests.
Conclusion The Federal Reserve's decision to decrease the federal funds target has a significant short-run effect on the economy by shifting the Aggregate Demand curve to the right. This shift reflects increased spending and investment due to lower interest rates. Other options, while related to monetary policy, do not accurately capture this primary outcome. Understanding these dynamics is crucial for analyzing the impacts of monetary policy on economic activity.
Natural rate of unemployment equals sum of:
Rationale
Natural rate of unemployment equals the sum of frictional and structural unemployment.
The natural rate of unemployment is defined as the level of unemployment that exists when the economy is at full employment, primarily composed of frictional and structural unemployment. These two types reflect the normal labor market dynamics, where individuals are temporarily out of work due to transitions between jobs (frictional) or mismatches between skills and job requirements (structural).
A) cyclical + structural + frictional Cyclical unemployment is related to the economic cycle and arises during downturns, making it a temporary state that does not factor into the natural rate of unemployment. The natural rate focuses specifically on frictional and structural unemployment, as these are always present even in a healthy economy.
B) frictional + structural This correctly identifies the components of the natural rate of unemployment. Frictional unemployment occurs when workers are between jobs or entering the workforce, while structural unemployment results from technological changes or shifts in market demand that cause a mismatch of skills.
C) seasonal + cyclical + frictional Seasonal unemployment relates to fluctuations in demand due to the time of year, while cyclical unemployment is tied to economic downturns. Neither of these components is included in the natural rate of unemployment, which only considers frictional and structural unemployment.
D) frictional + discouraged Discouraged workers are those who have stopped looking for work due to a lack of suitable job opportunities and are not counted in the labor force. Therefore, this choice incorrectly includes discouraged unemployment, which does not contribute to the natural rate.
Conclusion The natural rate of unemployment is fundamentally tied to frictional and structural unemployment, which represents the inherent fluctuations within a healthy labor market. Understanding this distinction is crucial for economic policy, as it informs the measures needed to address unemployment without creating additional cyclical unemployment during economic fluctuations.
Technology advance shifts SRAS and LRAS:
Rationale
Technological advancements shift both the Short-Run Aggregate Supply (SRAS) and Long-Run Aggregate Supply (LRAS) to the right.
Technological improvements enhance productivity and efficiency, leading to increased output capabilities in both the short and long run. As the economy benefits from these advancements, the overall supply of goods and services expands, prompting a rightward shift in both SRAS and LRAS curves.
A) both left A leftward shift in both SRAS and LRAS would indicate a decrease in overall supply, which contradicts the effects of technological advancements. Such a shift typically occurs in response to adverse events, like natural disasters or increased production costs, rather than improvements in technology.
B) both right Technological progress results in increased efficiency and productivity, causing the SRAS to rise as firms can produce more at existing prices, while the LRAS shifts right due to a permanent increase in potential output. This choice correctly reflects the positive impact of technology on supply.
C) SRAS left, LRAS right This choice inaccurately suggests that short-run aggregate supply decreases while long-run aggregate supply increases. A leftward shift in SRAS would indicate a reduction in supply, which is inconsistent with the effects of technological advancements that typically enhance short-run production capabilities.
D) no change Claiming no change implies that technological advancements have no effect on supply, which is incorrect. Such advancements inherently alter production capabilities, leading to a shift in both SRAS and LRAS. This choice overlooks the fundamental economic principle that productivity improvements result in increased supply.
Conclusion Technological advancements are pivotal in driving economic growth, as they increase productivity and efficiency in production processes. As a result, both SRAS and LRAS shift to the right, reflecting an increase in the economy's output capacity. Recognizing this relationship is essential for understanding how technology influences economic dynamics and growth potential.
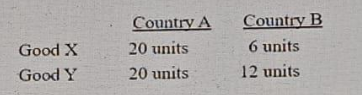
Country A: 20X & 20Y; Country B: 6X & 12Y. Which is true?
Rationale
Country A has a comparative advantage in X.
Country A can produce good X more efficiently than good Y compared to Country B, giving it a comparative advantage in the production of X. This means that Country A sacrifices less of good Y when producing good X than Country B does, making it more efficient in that specific production.
A) A has comp. adv. in X This choice is correct because Country A can produce 20 units of X while sacrificing only 20 units of Y, compared to Country B, which produces only 6 units of X and sacrifices 12 units of Y. The opportunity cost of producing X is lower for Country A, indicating a comparative advantage.
B) A has comp. adv. in Y This statement is incorrect as it suggests that Country A is more efficient in producing Y than X. Since Country A can produce 20Y but forgoes 20X, its opportunity cost of producing Y is higher than that of Country B, which can produce 12Y while forgoing only 6X. Thus, A does not have a comparative advantage in Y.
C) B has abs. adv. in X While Country B does produce some quantity of X, absolute advantage refers to the ability to produce more of a good with the same resources. Country A produces more of X (20) compared to Country B (6), meaning Country B does not have an absolute advantage in X.
D) B has comp. adv. in both This choice is incorrect. Country B cannot have a comparative advantage in both goods since it is less efficient in producing X. A comparative advantage means that one party sacrifices less of one good to produce another, which is not the case for Country B in either good.
Conclusion Understanding comparative advantage is essential for evaluating trade efficiencies between countries. Country A's ability to produce X at a lower opportunity cost than Country B confirms its comparative advantage in that good. This principle is fundamental in international trade, guiding countries to specialize in the production of goods where they hold a comparative edge, maximizing overall economic efficiency.
Natural rate of unemployment includes:
Rationale
Natural rate of unemployment includes structural, cyclical, and frictional unemployment.
The natural rate of unemployment is composed of frictional and structural unemployment, while cyclical unemployment is not considered a part of the natural rate, as it relates to economic downturns. Therefore, the combination of structural, cyclical, and frictional unemployment does not accurately reflect the components of the natural rate.
A) seasonal + cyclical + frictional Seasonal unemployment refers to job loss due to seasonal changes in demand for certain industries, which is not a component of the natural rate. While cyclical unemployment relates to the economic cycle, it does not contribute to the natural rate, which focuses on long-term unemployment factors like frictional and structural unemployment.
B) structural + cyclical + frictional This option includes cyclical unemployment, which is not part of the natural rate. The natural rate of unemployment specifically encompasses frictional and structural unemployment, reflecting the normal labor market turnover and mismatches in skills or locations, rather than fluctuations due to economic cycles.
C) frictional + structural This choice correctly identifies the components of the natural rate of unemployment, as it includes both frictional and structural unemployment. However, it omits cyclical unemployment, which is essential to differentiate since cyclical unemployment arises from economic downturns and is not a permanent feature of the labor market.
D) discouraged + frictional Discouraged workers are those who have stopped looking for employment due to a lack of opportunities, which does not fit within the parameters of the natural rate of unemployment. The natural rate focuses on frictional and structural unemployment, which are linked to active job-seeking behavior and labor market dynamics.
Conclusion The natural rate of unemployment is defined primarily by frictional and structural factors that contribute to the long-term unemployment rate in a healthy economy. While cyclical unemployment can fluctuate with economic conditions, it does not represent the natural state of the labor market. Understanding the components of the natural rate is crucial for evaluating economic performance and formulating effective labor policies.
Appropriate fiscal policy in deep recession:
Rationale
Increasing government spending is the appropriate fiscal policy in a deep recession.
In a deep recession, increasing government spending helps stimulate economic activity by creating jobs, increasing demand, and boosting consumer confidence. This approach is aimed at counteracting the downturn effects by injecting money into the economy.
A) Raise taxes Raising taxes during a deep recession would decrease disposable income for consumers and businesses, further reducing demand and exacerbating economic contraction. This policy would likely lead to lower consumer spending and investment, which is counterproductive in a time when economic stimulation is essential.
B) Cut spending Cutting spending can lead to reduced public services and job losses, which would negatively impact economic growth. In a recession, reduced government expenditure can worsen the economic situation by limiting demand and deepening the downturn, making it an inappropriate choice for fiscal policy.
C) Raise reserve ratio Raising the reserve ratio is a monetary policy tool that banks use to control the amount of money available for lending. While it may help control inflation, it would restrict the availability of credit during a recession, hampering economic recovery efforts. This approach does not directly address the need for increased government spending to stimulate the economy.
D) Increase government spending Increasing government spending injects funds into the economy, creating jobs and encouraging consumer spending. This approach directly addresses the issues of high unemployment and low demand, making it a cornerstone of effective fiscal policy during economic downturns.
Conclusion In summary, the most effective fiscal policy during a deep recession is to increase government spending, as it stimulates economic activity by enhancing demand and creating jobs. Conversely, raising taxes, cutting spending, and increasing reserve ratios are strategies that could hinder recovery and worsen the economic situation. Thus, targeted government expenditure plays a crucial role in revitalizing the economy during challenging times.
Higher saving rate → loanable funds supply and equilibrium interest rate:
Rationale
Higher saving rates lead to an increase in loanable funds supply and a decrease in the equilibrium interest rate.
When saving rates rise, individuals deposit more money into banks, increasing the supply of loanable funds. This increased supply typically leads to a lower equilibrium interest rate as lenders have more funds to offer, driving down the cost of borrowing.
A) Increase, Increase If the saving rate were to increase, the supply of loanable funds would indeed rise; however, this would not lead to an increase in the equilibrium interest rate. Instead, with more funds available, the equilibrium interest rate would decrease, contradicting this choice.
B) Increase, Decrease An increase in the saving rate results in a higher supply of loanable funds, which subsequently lowers the equilibrium interest rate. This reflects the fundamental relationship between supply and demand in the loanable funds market, making this choice correct.
C) Decrease, Increase This option suggests that an increase in saving rates would lead to a decrease in the supply of loanable funds, which is incorrect. Higher saving rates actually increase the supply, which would not drive the equilibrium interest rate higher but lower it instead.
D) No change If saving rates increase, the supply of loanable funds cannot remain unchanged. An increase in savings directly influences the amount of money available for lending, thereby affecting the equilibrium interest rate, making this choice incorrect.
Conclusion In summary, an increase in saving rates results in a greater supply of loanable funds, which subsequently leads to a decrease in the equilibrium interest rate. This relationship highlights the dynamic interplay between savings and interest rates in the economy, reinforcing the importance of understanding these financial mechanisms for both individuals and policymakers.
Oil price rise (widely used input) causes:
Rationale
Oil price rise causes output to decrease and price to increase.
An increase in oil prices, which is a significant input for many industries, typically leads to higher production costs. As a result, firms may reduce their output due to the increased expenses, while the decreased supply can lead to higher prices in the market.
A) Output ↑ Price ↑ This option suggests that both output and price increase with rising oil prices. However, as production costs rise due to more expensive oil, firms are likely to cut back on output instead of increasing it, leading to a contradiction with this choice.
B) Output ↓ Price ↓ This choice posits that both output and price would decrease. While it is true that output may decrease due to higher costs, prices typically rise as the market adjusts to reduced supply. Therefore, this option fails to reflect the correct relationship between oil prices and market dynamics.
D) No change This option implies that there would be no impact on either output or price as a result of rising oil prices. This is unrealistic, as significant changes in input costs—like oil—inevitably affect production decisions and market prices. Thus, it does not accurately represent the expected economic behavior.
Conclusion The rise in oil prices leads to a reduction in output due to increased production costs, while the resultant decrease in supply typically drives market prices higher. Therefore, the accurate relationship is that oil price increases cause output to decrease and price to increase, aligning with choice C. Understanding this dynamic is essential for anticipating market responses to fluctuations in key input costs.
Optimistic households & firms at full employment → short-run:
Rationale
GDP increases while price levels may rise or fall depending on inflation.
In a scenario of optimistic households and firms at full employment, the economy is likely to experience growth in GDP, while price levels are influenced by inflationary pressures that can either escalate or moderate economic conditions.
A) GDP – Price – This choice suggests a direct relationship between GDP and price levels without accounting for inflation. While GDP can rise, price levels can be affected by various factors, including inflation, which this option fails to recognize. Therefore, it does not accurately represent the dynamics of a full employment economy.
B) GDP – Price – Inflation This option accurately reflects that while GDP is increasing due to optimistic sentiments in households and firms, the impact on price levels is contingent upon inflation. In a full employment context, inflation can create upward pressure on prices, making this the most comprehensive choice.
C) GDP – Price – Similar to option A, this choice indicates a relationship between GDP and price levels but ignores the role of inflation. It fails to capture the complexity of economic conditions where inflation can significantly influence price dynamics, especially at full employment.
D) GDP – Price – Inflation This choice incorrectly implies that GDP and price levels are inversely related alongside inflation, which does not align with economic principles. An increase in GDP typically correlates with either stable or rising prices, making this option misleading regarding the short-run economic outlook.
Conclusion In a full employment scenario with optimistic households and firms, GDP is expected to increase, while the interaction with price levels is influenced by inflation. Option B encapsulates this relationship by acknowledging the potential for price changes under inflationary conditions, distinguishing it as the best choice among the alternatives presented. Understanding this interplay is essential for analyzing short-run economic behavior.
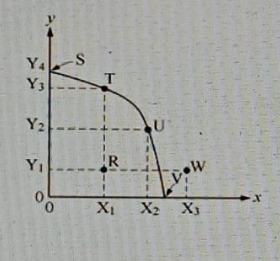
If the country specializes at point R on PPC, it is producing:
Rationale
only good X
At point R on a Production Possibility Curve (PPC), the country is maximizing its production of good X, utilizing all available resources for this specific output. The PPC illustrates the trade-offs between the production of two goods, and a point on the curve indicates full specialization in one product.
A) only good X This option accurately reflects the scenario at point R, where all resources are dedicated to the production of good X. By specializing entirely in this good, the country is operating efficiently at the frontier of the PPC, highlighting the maximum output achievable for good X.
B) only good Y Choosing only good Y would imply that the country is operating at another point on the PPC—specifically, at the opposite end of the curve. At point R, however, it is clearly focused on good X, indicating that this option does not represent the production scenario.
C) equal amounts Producing equal amounts of both goods would place the country at a point within the PPC rather than on the curve itself. This scenario would not maximize the production of good X, as it would require allocating resources to good Y, which contradicts the situation described at point R.
D) inside PPC Being inside the PPC signifies inefficient use of resources, where not all resources are utilized in production. Point R, being on the curve, demonstrates full efficiency and specialization in good X, making this option incorrect as it misrepresents the production context.
Conclusion In summary, point R on the PPC indicates that the country specializes entirely in producing good X, utilizing all its resources efficiently. The other options misinterpret the scenario by suggesting production of good Y, equal amounts, or inefficiency, which do not align with the principles of the PPC. This understanding is crucial for analyzing production choices and resource allocation in economics.
Policy that lowers nominal interest rate:
Rationale
Open-market purchase lowers the nominal interest rate.
Open-market purchases involve the central bank buying government securities, which increases the money supply in the economy. This action typically leads to lower nominal interest rates, making borrowing cheaper and stimulating economic activity.
A) Cut income taxes While cutting income taxes can increase disposable income and stimulate consumer spending, it does not directly influence nominal interest rates. Tax cuts can lead to higher demand, but their effect on interest rates is indirect and depends on various factors, including government spending and overall economic conditions.
B) Deficit-financed spending Deficit-financed spending refers to government expenditure that exceeds its revenue, funded by borrowing. While this can stimulate the economy, it may actually lead to higher interest rates as the government competes for funds in the borrowing market. Thus, it does not directly lower nominal interest rates.
C) Open-market purchase The central bank conducts open-market purchases to inject liquidity into the banking system. When the central bank buys securities, it increases the reserves of banks, which leads to a decrease in the federal funds rate and, consequently, lowers nominal interest rates across the economy.
D) Raise discount rate Raising the discount rate, which is the interest rate at which banks can borrow from the central bank, would have the opposite effect of increasing nominal interest rates. This action discourages borrowing and tightens the money supply, making it more expensive to obtain credit.
Conclusion In summary, an open-market purchase is a direct monetary policy tool used by central banks to lower nominal interest rates by increasing the money supply. This action contrasts with the other options, which either do not directly influence interest rates or could lead to an increase in them. Understanding these mechanisms is crucial for evaluating monetary policy's impact on the economy.
When economy is in equilibrium:
Rationale
When the economy is in equilibrium, aggregate demand (AD) equals aggregate supply (AS).
In economic terms, equilibrium occurs when the total amount of goods and services demanded by consumers (AD) matches the total amount of goods and services supplied by producers (AS). This balance indicates that the market is stable, with no inherent forces causing the level of output to change.
A) Output is max While maximum output may be a goal for an economy, equilibrium does not necessarily mean that output is at its highest possible level. An economy can be in equilibrium at various output levels, depending on consumer demand and resource availability, thus output being maximized is not a defining characteristic of equilibrium.
B) AD = AS This statement accurately reflects the condition for equilibrium in an economy. When aggregate demand equals aggregate supply, it signifies that the quantity of goods and services that consumers are willing to purchase matches what producers are willing to sell. This balance prevents either surplus or shortage in the market, establishing a state of equilibrium.
C) Inflation = 0 Inflation being zero is not a requirement for equilibrium. An economy can experience equilibrium while still having positive or negative inflation rates. Thus, while low inflation can be indicative of a stable economy, it does not define the equilibrium condition.
D) Unemployment = 0 Equilibrium does not imply that unemployment is zero. An economy can be in equilibrium with some level of unemployment due to factors like frictional or structural unemployment. Therefore, while full employment is often sought, it does not equate to the state of equilibrium in the economy.
Conclusion Equilibrium in an economy is characterized by the condition where aggregate demand equals aggregate supply, ensuring that the market operates without excess supply or demand. Options A, C, and D misinterpret this definition, as they incorrectly associate equilibrium with maximum output, zero inflation, or zero unemployment—none of which are necessary conditions for equilibrium. Understanding this distinction is crucial for analyzing economic stability and policy implications.
Low-carb fad decreases demand for high-carb food: equilibrium
Rationale
Low-carb fad decreases demand for high-carb food, leading to a decrease in both price and quantity.
When a fad diet such as a low-carb diet decreases the demand for high-carb foods, we can expect a leftward shift in the demand curve for these foods. This leads to a decrease in equilibrium price and equilibrium quantity in the market for high-carb food products.
A) Price ↑ Quantity ↓ This option suggests that as demand decreases, the price increases while quantity decreases. However, a decrease in demand typically results in lower prices due to excess supply, not higher prices. Therefore, this choice does not accurately reflect the market dynamics when demand declines.
B) Price ↓ Quantity ↓ While this choice correctly indicates that quantity decreases with falling demand, it inaccurately suggests that price also decreases. In cases of reduced demand, prices usually decline, but the wording here does not specify that price and quantity both decrease, making it an incomplete representation of the situation.
C) Price ↓ Quantity ↓ This choice accurately reflects the scenario: as demand decreases due to trends like low-carb diets, both the price and the quantity of high-carb foods decline in equilibrium. The decrease in demand leads to lower prices as suppliers adjust to the lower quantity demanded, hence this is the correct answer.
D) No change This option implies that the equilibrium price and quantity remain unchanged in response to a decrease in demand. However, a significant shift in consumer preferences, such as the rise of low-carb diets, would not leave the market unchanged. Thus, this choice contradicts fundamental principles of supply and demand.
Conclusion In summary, a decrease in demand for high-carb foods due to the popularity of low-carb diets will result in decreased prices and decreased quantities of those foods in the market. Choice C best captures this outcome by illustrating the expected market response to the shift in consumer preferences. Understanding these dynamics is crucial for analyzing market behavior in response to changing dietary trends.
Yen depreciation → Japan exports:
Rationale
Yen depreciation increases Japan's exports.
When the value of the yen decreases, Japanese goods become relatively cheaper for foreign buyers, leading to an increase in export demand. This economic principle suggests that a weaker currency encourages international sales, enhancing Japan's export performance.
A) – This option suggests that there is no impact on Japan's exports due to yen depreciation. However, this is incorrect as a weaker yen typically makes Japanese products less expensive for foreign customers, thus increasing their demand and boosting exports.
B) ‘ This choice accurately reflects the relationship between yen depreciation and Japan's exports. A depreciated yen lowers the price of exported goods in foreign markets, making them more attractive to international buyers and subsequently increasing export volumes.
C) no change This option implies that yen depreciation has no effect on Japan's export levels. In reality, currency depreciation usually leads to increased exports because it enhances competitiveness abroad by making products cheaper for foreign consumers.
D) ‘ then – This choice suggests an initial increase in exports followed by a decrease, which misrepresents the typical outcome of yen depreciation. Generally, depreciation leads to a sustained increase in exports rather than a temporary spike followed by a decline.
Conclusion Yen depreciation has a well-established positive effect on Japan's exports by making products more affordable for international markets. Consequently, while some options suggest neutrality or a negative outcome, the accurate understanding is that a weaker yen consistently fosters increased export activity, thereby supporting Japan's economy.
You are leaving this quiz
What would you like to do with your progress?
You're in the middle of a quiz
What would you like to do before switching?
Practice complete
You finished this free practice quiz.